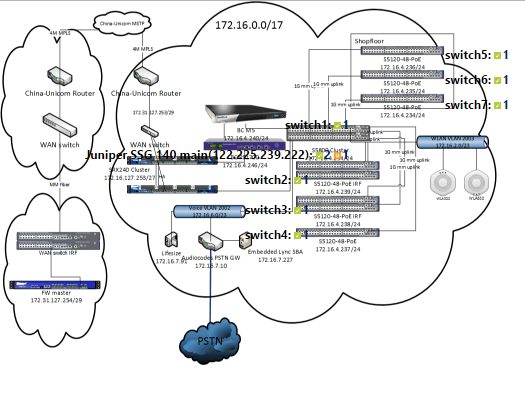
Click the image to experience the PRTG topology immediately
Click a picture to experience PRTG topology immediately. Dilian produces examples of PRTG topology based on customers’ topology
Users can click the picture above and log in to our visitor account to see the device name and corresponding sensor status of each device attachment
A green checkmark means everything is fine
Orange U indicates outliers during the working day
Click to see more detailed data
PRTG Topo Demo Map
Experience DELine's advanced network monitoring technology with a PRTG topology diagram example. This interactive map demonstrates DELine's PRTG topology capabilities tailored to customer network needs. Users can explore detailed device names and sensor status, and intuitive symbols show normal operation and abnormal conditions. This tool provides a visual and user-friendly way to monitor network health and performance, underscoring DELine's commitment to providing advanced network management solutions. For IT professionals seeking efficient network regulation, the PRTG topology diagram example is proof of DELine's innovative approach to network optimization