**Network Topology Design: Building Efficient and Secure Enterprise Network Architectures**
Network topology design is a cornerstone in constructing modern enterprise information infrastructure. This article systematically explains how to start from foundational concepts, combined with PRTG Network Monitor and NetFlow V9 data, to achieve network traffic visualization and security monitoring. It will help you optimize network performance and ensure business continuity. Through scientific design and real-time monitoring, you can build an efficient and secure enterprise network architecture. 🚀
—
### Designing Efficient Network Topology: From Basics to Best Practices
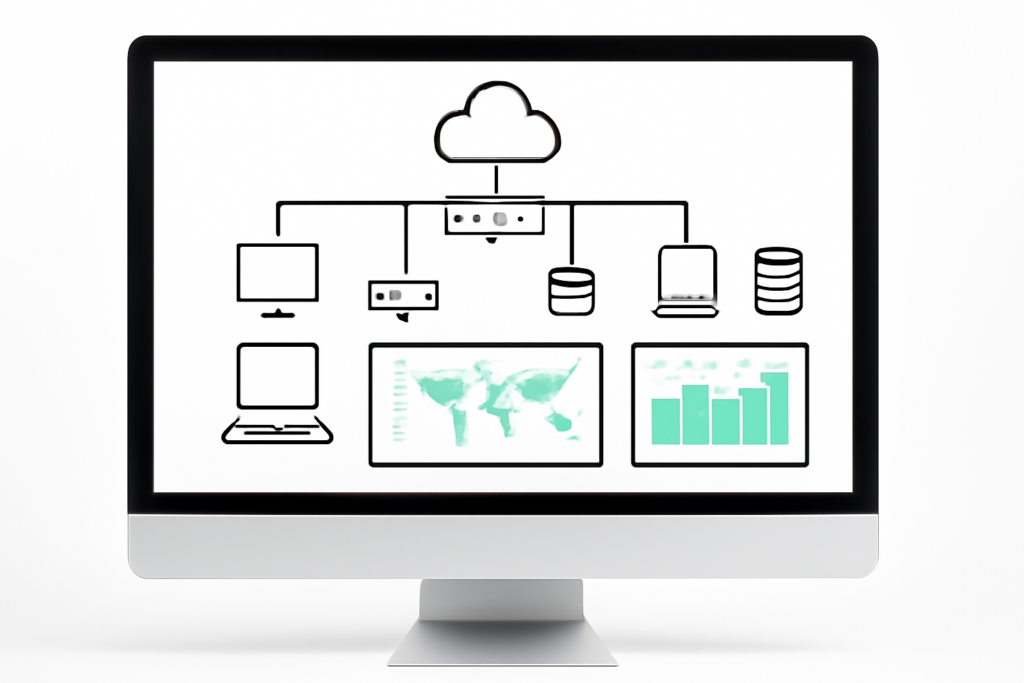
Network topology design determines the pathway and efficiency of data transmission in a network. A well-designed network topology can improve transmission performance, scalability, and fault tolerance. A topology diagram shows devices and their connections, and its shape plays a crucial role in network performance.
Common topology types include star, ring, bus, and distributed networks. Distributed networks, with decentralized nodes and redundant connections, significantly improve reliability and flexibility, making them suitable for modern enterprises. For example, a multinational company using a traditional bus topology might face a single point of failure causing total network downtime, whereas a distributed network offers multiple paths so that even if some nodes fail, data rerouting ensures uninterrupted service.
When designing, consider bandwidth needs, latency sensitivity, and security segmentation. For instance, placing critical core servers at high-capacity switches centrally, with peripheral devices connected through secondary switches, guarantees smooth core data transmission. Also, VLAN technology helps logically segment the network, assisting security enforcement and broadcast storm control.
In summary, efficient network topology design requires aligning with business needs, leveraging flexible devices, and building a scalable architecture. A proper design lays the foundation for subsequent traffic monitoring and security optimization and relies on deep understanding and precise planning of the topology.
—
### Using PRTG Network Monitor to Collect and Analyze NetFlow V9 Data
For precise network traffic analysis, pairing PRTG Network Monitor with NetFlow V9 protocol data collection and parsing is a well-recognized robust solution. NetFlow V9 is an extensible traffic monitoring data format providing detailed flow information such as source, destination, protocol, and ports, ideal for bandwidth monitoring and network security analysis.
Key steps to configure PRTG for NetFlow V9 data collection include:
1. **Enable NetFlow Export**: Activate NetFlow V9 export on routers or switches, setting the PRTG server IP and port as the destination.
2. **Add PRTG Sensors**: Create NetFlow sensors within PRTG and specify the receiving port and parameters to ensure proper data reception.
3. **Data Preprocessing**: PRTG aggregates and computes metrics like bandwidth usage and peak traffic automatically.
4. **Flow Analysis and Node Monitoring**: PRTG provides detailed node views to identify top talkers or anomalous traffic effectively.
PRTG excels in traffic analysis; for example, a large manufacturing firm detected unusual access from a supplier via PRTG and promptly adjusted access permissions to prevent data leaks. According to [PRTG official documentation](https://www.paessler.com/manuals/prtg/netflow_v9), precise NetFlow configuration enhances network visibility and security detection, an essential complement to topology design.
—
### Building Visual Network Topology Maps: Real-Time Monitoring and Bandwidth Optimization
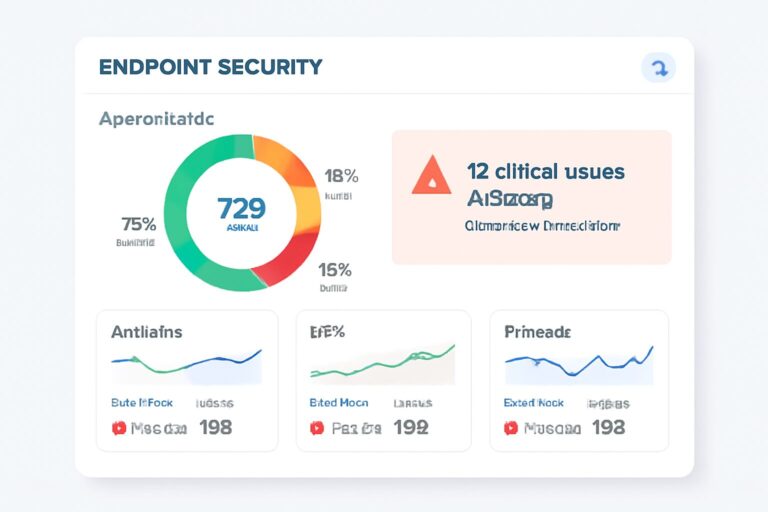
After acquiring accurate traffic data, visualizing the network state for bandwidth optimization is key. PRTG’s built-in visualization tools are core assets. Network admins can monitor the entire network state in real time via topology maps and dynamic dashboards.
PRTG’s topology map dynamically displays all nodes and connections, with node colors and link statuses changing according to current load—for example, link lines turning red when bandwidth spikes occur, signaling congestion. This provides instant insight into bottlenecks.
Dashboards show bandwidth usage, traffic trends, and node response times. Based on this data, teams can:
– Automatically identify overloaded links;
– Adjust traffic policies or upgrade hardware timely;
– Optimize load distribution to prevent congestion.
For instance, a financial firm used PRTG reports to find nightly backup traffic causing bottlenecks on a link and resolved it by rescheduling backups and balancing loads.
Combining topology visualization with traffic data fulfills performance monitoring needs and provides scientific support for network maintenance decisions.
—
### Identifying Network Bottlenecks and Security Risks with NetFlow V9 Reports
NetFlow V9 not only supports bandwidth optimization but is also powerful for detecting security risks. Detailed traffic summaries and anomaly detection help quickly locate bottlenecks and threats.
Key features include:
– **Anomaly Detection**: Spotting traffic surges to identify DDoS attacks or malicious scanning;
– **Threat Source Tracking**: Using IP geolocation and application types to recognize attackers and block them;
– **Log Correlation**: Combining NetFlow data with security logs for accurate problem pinpointing.
For example, an e-commerce company found external IPs aggressively accessing the backend using NetFlow V9 data. Automated alerts allowed the security team to block those IPs swiftly, preventing intrusion.
Using deep traffic indicators from NetFlow V9 enables enterprises to continuously refine security policies and strengthen defenses.
—
### Practical Case: Distributed Network Performance Monitoring and Automated Alerts with PRTG
In distributed networks, with diverse and geographically dispersed nodes, real-time monitoring and rapid fault response are challenging. PRTG’s automated alerts are vital for efficient operations.
A multinational enterprise implemented:
– PRTG servers at core and branch offices, integrating NetFlow monitoring for all nodes;
– Threshold-based alerts (e.g., bandwidth exceeding 80%) sending notifications automatically;
– Distributed node monitoring providing unified visibility across sites;
– Automated scripts linked with alerts for fault recovery or swift troubleshooting.
In practice, when a site’s link traffic spiked unexpectedly, PRTG sent alerts to the ops team’s phones, enabling quick mitigation, reducing repair time by 70%.
This case proves that combining topology-aware distributed design with PRTG monitoring significantly improves network reliability and operation efficiency.
—
### Enhancing Network Security Strategies via Topology and Traffic Visualization
Network security is inseparable from topology design. Using topology maps and traffic visualization, companies can precisely craft access controls, firewalls, and intrusion detection mechanisms.
Specific tactics include:
– Adjusting ACLs based on traffic analysis to curb unauthorized pathways;
– Highlighting key secure nodes on topology for focused monitoring;
– Establishing firewall rules to automatically block suspicious flows detected from anomaly reports.
For instance, a high-tech company isolated financial system nodes into a secure VLAN zone, refining network policies per traffic patterns and successfully thwarting lateral internal attacks.
Fine-grained security strategies depend on well-designed topology and accurate, real-time traffic data.
—
### Ongoing Optimization and Maintenance: Upgrading and Scaling Network Topology
Networks are evolving systems. As business grows, topology designs must evolve. Maintenance strategies include:
– Periodic bandwidth load assessments, augmenting capacity or adjusting load balancing;
– Using visualization tools to check new device integrations and prevent bottlenecks;
– Planning expansion with layered designs and Software-Defined Networking (SDN) for agility;
– Regular security assessments using updated threat intelligence to keep defenses current.
IDC reports indicate that continual topology optimization reduces failures and improves availability by over 15%. Enterprises should institutionalize maintenance processes balancing responsiveness with long-term planning.
—
### FAQ
**1. What are the key goals of network topology design?**
To ensure efficient, stable transmission with scalability and security.
**2. How does PRTG support network topology monitoring?**
By collecting traffic data, generating dynamic topology maps, and creating real-time dashboards.
**3. What advantages does NetFlow V9 have over other protocols?**
It supports extensible fields enabling detailed data capture suited for complex networks.
**4. How can automated alerts improve network operations?**
By triggering notifications on threshold breaches, enabling quick response and minimizing downtime.
**5. How to ensure security when designing distributed networks?**
Segment secure zones, implement access controls, and continuously monitor flows.
**6. Are there free tools to replace PRTG for topology design?**
Free tools like Zabbix and Nagios offer monitoring but lack PRTG’s comprehensive functionality and usability.
De-Line Information Technology understands enterprise network requirements deeply, offering top-tier network topology design and traffic monitoring solutions. Visit [De-Line Official Website](https://www.de-line.net) to learn more and build a high-efficiency, secure network future! ✨
************
The above content is provided by our AI automation poster


